Sponsors

Monday, July 31, 2006

BRZ selling itself

There are rumours around that the BRZ may be selling off some of its operations in an effort to streamline costs. There is also a rumour that the whole business could be sold to private equity buyers.

This is a very interesting thing to look at in the context of BRZ. It currently is great value for any buyer as most of its businesses are producing good profits over the christmas periods. Why they would be selling the business before the best part of the year is a loss to me.

But this is good for investors who have bought recently. It should hold the company stock price at the current level with speculation of a buyout. It should go for better terms then then current share price as well which would be a boost to any recent buyers.

But it is a poor outcome for anyone who held the company from its highs. They will not be able to recover thier losses if it gets bought out.

Well I guess its a wait and see approach but hopefully BRZ will not be selling its most profitable businesses such as BNT and Diva.

Annual Rerport is out in 4 weeks so lets see the figures before we decide whether to hold or exit the stock.

Good Luck

Sunday, July 30, 2006

Quick Update

Thought I would just put together this quick update to see which stocks are thought to be good value and at what price :

BRZ : $1.40-$1.50
FUN : $1.65-$1.75
MOC : $1.50-$1.55

I own all three stocks and this blog does not recommend you buy the stocks without first researching the company yourself. This blog is purely here to open your eyes to some opportunities.

Good Luck

Annual Reports

I have been looking at many annual reports lately for lots of companies and I just thought I would post some comments on them.

You can always tell what type of company it is based on the annual report. Take a look at Brazin and you will notice lots of women in underwear and a very sexy layout. This has two motives, to make the company look attractive and also to help distract the investor. In the Brazin case there was a few things which were noted in the review but overall they still looked good value. If you look at Funtastics report you will toys and a real comic type of layout with lots of pictures, charts and bright colours. This reflects the same way they advertise to kids and it shows in the directors reports which are a bit basic and you need to delve into the numbers a bit further to fully get a feel for the financial status of the company. Finally looking at finance company such as Mortgage Choice, you will see clean cut very factual statements. There is not as much colour or distractions and everything is focused on numbers.

I just thought it interesting as each company has to report the same information but they all layout it out based on the style of their business. This can be a pain sometimes as it hides important information in the back of the document and it takes a while to read through and find. but overall the annual report gives a nice indication and a feel for the business to the investors.

Have fun and let me know if you find any good annual reports worth looking at... I would recommend Brazin and Funtastic as they are both very interesting to read.

Good Luck.

Saturday, July 29, 2006

FUN - Company Analysis

Here is some quick analysis on why Funtastic is a good company and might be worthy of a purchase.
Company profile
Funtastic Limited (FUN) is leading childrens products distribution and marketing company. FUN has several divisions marketing toys, stationery, apparel, infant goods, DVDs and food products all aimed largely at the child market. FUN has acquired a range of licences to manufacture (mostly offshore) and distribute popular childrens products. FUNs range includes long life and short life brands and products.

Company Strategy
FUN has grown organically through an increased number of new licensing relationships with major trademark and brand owners in its six divisions, as well as through the acquisition of complementary distributors.

FUN is an increasingly dominant manager of childrens brands in Australia. It is also looking to license proprietary product offshore. An example is FUNs patented baby stroller. It is critical FUN continues to provide customers, include the large department store retailers, with a compelling value proposition to ensure they do not source directly from licensors. Cost efficiencies and bolt-on acquisitions should offset weakness in consumer spending according to comsec.

FUN reported NPAT up 36% to $21.6 for the year ended 31 December 2005. Revenues from ordinary activities were $348.2m, up 11% from the same period last year. Diluted EPS was 16.2 cents compared with 12.3 cents. Net operating cash flow was $27.8m up from $12m. The company declared a final dividend of 6.5 cents, making the full year dividend for 2005 10.5 cents fully franked compared with 8.5 cents.

Institutaional Ownership

Institutaionl ownership pushes a share price up or down significantly depending on the support. Looking at the breakdown of shareholders there is only 4 major shareholdings. These are UBS at 8.16%, NSR Toys at 7.03%, Westpac at 6.32% and AH Meydan at 6.25%.

This leaves a lot of shares being held by smaller investors. In fact the top 20 investors only hold 52.25% of the company. This gives ample room for funds to move in and purchase shares in the company. For instance there is no Commonwealth or Colonial, or Perpetual holdings in the top 20 shareholders. There is ANZ, National, UBS, Westpac, JP Morgan and a couple more smaller fund managers in the list. They may also want to acquire further shares in the future, and there shareholding is not large enough to be detrimental to the share price if they sold all of their holdings.

Charting the stock

Looking at the chart shows that the stock has been in a slight downtrend for the last year and may be going sideways the last few months. This shows solid support around $1.50 and could go higher if it breaks the current range.

Looking at volume you will otice volume spikes i this company usually signal a change in trend. There was a volume spike in December 2004 which signaled a big drop, a volume spike in September 05 to signal another significant drop and finally a volume spike in July 2006 which started a spike upwards. This latest volume spike may signal that the sideways movement is about to finish and might help the share climb out of its sideways movement. If it does we can expectthe share to move up to the $2.00 area.

Growth

Growth is a very important factor in share price movement and we need growth to make substanital gains. The following growth was achieved at the company in the lastest annual report (March 2006) :

  • Net Sales up 11.1%
  • EBIT up 36%
  • EPS up 30.5%
  • CashFlow up 131.7%
  • Net Profit up 36%
  • Free Cashflow up 160%
  • Dividend paid up 23.5%
  • Toy market share gre from 19% to 24%
  • Publishing market share increased from 7.6% to 10.3%

The first thing to look at is where did this growth come from. This is explainable by delving a bit deeper into the numbers :

  • The net profit margin was increased from 5.4% to 6.2% which shows they have increased efficiencies from either increased sales or cost cutting measures.
  • The long term debt has doubled indicating they have acquired businesses (planet fun and Dorcy Erwin Pacific) which add to the overall revenue and profit for the company.
  • The increased debt allows greater tax deducations which may offset some of the interest costs when compared to the profit the acquisiton is making for the company.
  • They divested the electical product range which may have been a poor profit margin product range.
  • The company attributes the growth to better trade terms due to market position with key vendors.
  • There has been major focus on invetory management therefore reducing coss for storage, etc and increasing the net profit margin.
  • They have focused on debt collection which can alwasys be a tricky area.

Future growth is as important as past growth. Furture growth for this company may come from the following areas:

  • They own the Pirates of the Carriban Range and the second movie should spark interest in the product.
  • They have storng brands such as TMNT, Bratz, Tamagotchi, Thomas the Tank Engine and Spider man. These are toys that will sell well due to the high recoginition of the products from movies and television shows.
  • They have acquired licences for Socceroo childrens wear which should e a major product range with the world cup just completing. They have also gained other footwear and apparel licences which will increase their market share and therefore may offer better terms of trade with suppliers.
  • They are positioning themselves as market leaders in the nusery range such as strollers. This is a god idea with the number of babies pe household rising in the last year. The baby bonus also gives families the money to spend on these items which are necessities in some cases.
  • They are growing the confectionary range and there should be solid growth in this area for the next few years.
  • They have a continued focus on working capital and operating cashflow which should allow the company to minimise costs and take advantage of key opportunities when they arise.
  • FUN has targeted more acquisitions to increase their market share and provide future growth. FUN management have done a good job of finding the right acquisitions rather than any acquisition. They have been able to find opportunities which have allowed the company to grow and increase profits. This track record stands them in high regard for furture acquisitional growth.
  • They are taking an opportunity to move some of their own products global which may be beneficial for the company. There are risks with this strategy though.

Profitability

Profitability looks at the area on how much money (profit) is the company generating relative to the money which is invested into it. This is a key area as we need to invest in companies that make money and produce a return for their shareholders.

Return on Equity is an industry standard to determine how well a company is performing and how well it is in creating wealth for its shareholders. The ROE for FUN has been outstanding. The past 7 years has shown ROE figures of 16% or higher . This shows the company is doing a good job of managing their capital.

There are 3 ways a company can boost its ROE figures and this needs to be investigated before the figures can be regarded as authenticate returns. The ways a company can boost their ROE figures are net margins, asset turnover and financial leverage.

Net margins for FUN are excellent for this type of business, and while it has a fair bit of debt shown by debt to equity ratio of 44% I think the companies management are on the correct path and should slowly reduce the debt over the next few years. They have used the debt to buy solid assets which will generate good earnings for the company. To see whether the debt has helped the shareholders gain money can be seen by the ROE being higher than the ROC which is is in this case for the last 3 years.

Free Cash Flow is another measure which can give some indications into how a business is prospering. Free Cash flow is very important as this is the excess money generated by the business which is available for shareholders ( or available for the company to reinvest and expand the business ). My preference is usually for the company to give dividends as I can probably better invest the money elsewhere. Looking at the financial report shows that FUN has been increasing their payout ration (up from 33% to 65%) and provides adequate dividends at 6.4% (on $1.74). Free Cashflow is determined by taking the cashflow and removing the capital expenditure.

2005 Free Cash Flow = Cashflow – Capex = 20.8 – 2.3 = 18.5.

This shows the company has a strong cashflow position. This was a highlight of the company report and I expect they will continue to genreate good rfee cashflow positions in the future. Deteriming if this is enough free cashflow can be tricky as a guide we should aim for 5% of the sales revenue. Free Cashflow as per Revenue = 18.5 / 347 = 5.3% which is right on our target of 5%.

We can also look at the net profit for the last few years. This shows the company has conistently lifted its net profit year after year. It has gone from 1 million to to 3 million to 9 million to 14 million to 16 million to 21 million. That is a steady increase that hopefully will continue in the future.

Financial Health

Financial health looks at the current snapshot of the company and how well a foundation it has created itself. A company needs a strong financial health to ensure it does not run into extra costs and other financial burdens which could arise in the future.

The first figure to examine is the debt to equity. In this case it is 44%. This is a bit high due to recent purchases but I believe the purchases were good acquisitions and should enhance the profitability of the company. This follows a track record of good acquisitions and shows management thinks carefully before purchasing brands, products, etc.

The second figure is times interest earned which is how many times the company could pay the interest on its debt. The figure for the company is 9.11 which is a good figure considering the ASX average is 5 and the sector average is 7. This means they make enough money to cover their interest payments by 9 times.

The current ratio is how quickly a company could sell off assets to pay off debt. A general rule is 1.5 and FUN currently has a current ratio of 2.78. This is good as it is higher than our benchmark. The quick ratio is very similar to above except it is a bit more meaningful as it removes inventories which may be sold at a price lower than they are worth. A ratio above 1.0 is a good figure and FUN is showing 1.53. You can see how inventories are a major part of this company as it lowered the current ration by more than a whole point. Still the company looks in good shape.

A last test is to ensure the company has more Assets than it does liabilities. In this case it has 214 million in total assets and 100 million in total liabilities. This means if something drastic happened all debts could be paid and 114 million is available for shareholders.

Risks

There are numerous risks to this company including :

  • Cosumer spending will be down due to higher petrol prices and interest rate increases.
  • They are competing agaisnt fierce competiton and brand recognition is important. Losing brands could severaly hurt the company. In fact an announcement last week shows they lost a supplier due to a takeover. This will have a 9 million decrease effect on turnover.
  • They have a semi-large debt to equity ratio which they will need to reduce quickly in case of interest rate rises.
  • They do not develop many products and just hold the licences to distribute to suppliers. They must keep their prices low and offer extra services otherwise sellers could get their products directly from the suppliers.
  • The chairman retired and there is no guarntee the new chairman will be as effective managing the business.

Management

Management is one of the most important aspects to look at when deciding whether or not to buy a company. it is management that makes all of the important decisions which could make or break the investment.

The reitrement of the chairman puts some added risks to this purchase. While the new chairman is the founder of the company and should have good business sense it is always hard to guage the effectiveness of the new chairman until a few years has past. At this stage I believe the board as a whole should have the expereience to take the company futher in to the future.

Firstly the renumeration policy should be checked. While I think all directors are overpaid, it is worthwhile checking they are not excessively overpaid. The total cost of all directors is 2.5 million. The renumeration is broken into 3 parts, fixed salary, performance incentives and long term incentives. This at least puts some of the 2.5 million at risk and gives management a carrot to aim for. Overall 2.5 million is a bit excessive considering the Net profit was only 21 million. This is slightly more than 10% of the overall profit. It should be under 10% of net profit.

Managements direction for the future needs to be looked at to ensure they are not boosting numbers now which will ultimately decrease profits in the future. Looking at FUN they have focused on reducing costs which is a good thing. They are also selling off unaligned businesses (electronic business). This is also a good idea. I also like their direction of expanding the company by buying acquisitions which they have proven to be able to align with the company and make profitable very quickly.

Overall I like the direction management is taking the company. They seem to be open about issues within the company and the direction they intend to take They are quick to inform the company of likely losses of revenue but they have also positioned the business to be able to handle these types of risks.

Target Price and Sell Targets

The target buy and sell points will be different depending on different peoples analysis of the company. I do not subscribe to the Discounted value system and instead prefer some easier figures to tell me whether or not the company is at a good value.

Firstly I like a high dividend. Usually I would aim for 5% fully franked but there are always exceptions to the rule. In this case the dividend yeild is closer to 6.4% fully franked. I like a higher dividend to provide some buffer against a falling price. Based on the 5% rule I would stake a rough estimate of approx $2.36 ( 11.8c / 5%).

Secondly I like to see a PE ratio which is not too high. This differs between sectors. FUN is at 9.7 while the market sits at 15.70 and sector at 11.70. This shows that FUN has a low PE ratio compared to the average. I like PE ratios which are low as they provide a quick indication that the company is earning good money relative to their value. Something to be careful of though is that there might be a low PE because the price has dorpped based on thoughts that the future earnings might be smaller. Looking at FUN shows estimates are for an increase in EPS from 19.2 to 21.5. If the estimates are correct assuming the PE ratio remains steady we should see the company move from the current price to $2.08. If we assume earnings are going to reamin steady and FUN comes back to the sector average we should see it rise to $2.24 .
Technically I can see the share moving back to resistance around 1.80. It would need to break this level before it could start a nice uptrend.

Based on the price estimates of $2.36, $2.08 and $2.24 We would look for a buffer where we see value. Usually a 20% buffer is a good start and in this case I don't think we need to increase it dratatically as there is no major risks to the company. Using a 20% buffer puts the buy for each of the estimates at around $1.88, $1.66 and $1.79. This is a broad range of estimates on the value of the company. I like to take a figure somewhere between the lower two values and this would indicate a value somewhere around $1.66-$1.79.

Sell targets would be analaysed as the share releases new reports but initially we should stick to our lower estimated value of $2.08. At this price the share would be fully valued and any gain from there would be minimal. At that stage we should look for other shares unless this share is showing reasons for its solid performance.

Overall

The company looks to be undervalued and while the economy has high inflation from petrol it may be found that the profit stays in check. But parents have this uncanny ability to overspend on their kids ascan be seen every christmas. This will buffer FUN from any slowdown in the economy. Also the baby bonus will help buffer FUN from this likely slowdown.

Managment appears to know what they are doing and if they continue the good work the company could grow dramtically in the next boom cycle. There is ample growth for instutional support and they are in a strong financial position.

I believe this company is a good purchase anywhere up to $1.79.

Good Luck

Friday, July 28, 2006

Brazin Loss second half of the year

Brazin brought out a report yesterday signalling a review of the structure of the company. Reading the report it would sit exactly in line with my analysis of where possible growth could come from and that was to reduce costs and focus on maximising profit from existing brands. This is the gist of the announcement.

But there is one line signalling that management expects results to be slightly better than last years net profit. Since the half year was a good result this only leads to suggest that they lost money in the 6 months since Jan. Again this fits perfecly with my analysis as most of the sales comes from Christmas.

Fortunately this dropped Brazin back to 1.40 and back into the targeted buy range. Since then it has moved back up to 1.47. At this level I expect it to hold and / or move higher. I do not expect it to drop lower than 1.30 based on the fundamentals but you never know.

The Annual report will be released at the end of the month and I shall review it then and post any important information in regard to this company.

Good Luck.

Thursday, July 27, 2006

CXP - Easy money

For those who like trade instead of investing take a look at CXP.

This company has good fundamentals and can be traded from the $5.65 to $5.85 range. This is a 3%-4% swing every few weeks.

The best way to trade it is to wait for the share to drop under $5.70 and then as soon as it breaks the previous day high buy it. This usually gets an entry point around $5.65 - $5.72. Then set an order to sell out around the top of the range at $5.85 to $5.90.

Its about as easy a textbook trading range as you will find in the market.

When this stock breaks the range I expect it to break up not down as the fundamentals are solid for the company but it is still priced slightly to high to be a great investment.

Good Luck.

Wednesday, July 26, 2006

Inflation

Inflation figured were released today and they don't look good for the market.

Apparently CPI rose 4% in the last 12 months with a rise of 1.6% this quarter. It is attributed to petrol costs pushing up prices for other items.

This will lead to another interest rate rise but talk is that it may now be a 0.5% instead of just a 0.25% increase. This will hit hard for those with large mortgages who are already finding it difficult to pay the monthly interest bill.

How does this affect the market ? Well it means people have less money to spend, therefore profits for companies will not be as high as they will have reduced revenues, Companies with debt will have higher interest costs and this will push down profits. With lower profits, alternative investments become better options as the growth and income will not be available in the share market. People will take their money out of the market and the market will decline. The higher interest rates go, the more money moves to term deposits and high interest bank accounts as they rise with the rising interest rates.

This can be a bargain time to be buying stocks if you buy the right kind of stocks in the first place. This is where technical analysts get hurt IF they do not know how to short sell, or make money in a declining market.

This is a minor issue for fundamental analysts who have taken a rising interest rate into account. I am happy with my selections and would not want to sell them at this stage unless there is a drastic change to the fundamentals or my assumptions are proven wrong on the shares I purchased.

Well I hope that helps with everyone's trading and investing .....

Good Luck...

Tuesday, July 25, 2006

BRZ analysis complete and time to look at FUN

I have finished the review of BRZ and posted it. I am now going to take a look at FUN. It has a cool name and I think it could be well positioned to take advantage of the current baby boom affecting Australia.

Sunday, July 23, 2006

Update

Just to let everyone know I will have a detailed look at Brazin Ltd in the next few days and will have the report posted for you to go over. I am still checking some figures and delving into the numbers a bit further before posting it.

After that I intend to write analysis for the following companies :
CXP
ASU
FUN
MCW
MMA

From there I am happy to take some requests on other companies. I am doing the above companies first as they are the stocks I already own and I am just updating my analysis as they are slightly out of date as new earnings reports have been issued for most companies.

Good luck.

BRZ - Why I bought it ?

Here is some quick analysis on why Brazin is a good company to purchase at its current price.

Overview
Brazin is a diversified retailer selling recorded music, DVDs, womens lingerie, cheap jewellery, sleep wear, swim wear and home wares. It operates some 700 retail stores Australia wide. Its brands include Sanity Entertainment, Virgin entertainment, BNT (Formally Bras n Things), Aztec Rose, Dusk, Diva, HMV and Ezydvd.

Company Strategy
A change in management has shifted the strategy to rebuilding core brands and exiting loss making businesses. Brazin excited the loss making operations of Ghetto and Insane in 2005.

Growth will be driven from store rollout of established chains and development of Dusk and Diva chains and consolidation of recent acquisitions. BNT should be driven by successful marketing of the Short Stories and Hanky Panky lines. BRZ is targeting 15 new stores by June FY06. Organic growth should benefit from new products in the Hanky Panky and the Truly Me lines. Insatiable demand for value fashion accessories should see Diva continue to deliver strong growth. We expect store expansion and marketing initiatives to drive organic growth. BRZ had 101 stores by February 2006. Stores are usually profitable in a short time. BRZ acquired 32 HMV stores for $4m. Store numbers are likely to be reduced to 25 and rebranded to Sanity or Virgin once leases expire. BRZ plans to install MP3 download kiosks, to offset the pressure from iPod sales and declining price points in CDs and DVDs. These kiosks were launched in February 2006. BRZ 50% acquisition of EzyDVD Pty Ltd is part of its strategy to gain exposure to a growing sector of the entertainment business. Continued roll out of stores will grow top line sales. EzyDVD is expected to have 80 stores by June 2006.

Brazin reported NPAT up 29.6% to $19.3m for the half-year ended 31 December 2005. Revenues from ordinary activities were $300.9m, up 21.4% from the same period last year. Diluted EPS was 16.2 cents compared to 12.6 cents last year. Net operating cash flow was $55.8 compared to $50.8 last year. The interim dividend declared was 8.5 cents compared with 8.0 cents last year. The halfs results were driven by strong sales by the group, including the newly acquired HMV business. The Diva chain also made a solid $7.4m contribution to the group profit.

All brands reported improved stock turn rates and inventory productivity during the half. Ghetto and Insane are in the final stages of closure. The cumulative FY06 costs of discontinuing these operations are estimated to be $2.4m after tax, slightly higher than the previous estimate of $2.0m after tax.

Institutional Ownership
A stock requires institutional ownership if it is to grow. This is because it is mainly the institutions that push the price of stocks higher with their ever increasing inflow of money (from superannuation). If a stock has too much institutional ownership it makes the stock stagnant and/or a favourite for speculators. This is taken from the 2005 annual report and maybe slightly out of date. The top shareholders are below:


Shareholder Percentage of Company
Yoda Holdings

58.9%

National Nominees

5.9%

J P Morgan Nominees Australia

4.5%

RBC Global Services Australia

3.8%

Coloskye Pty Ltd

2.7%

Westpac Custodian Nominees

2.2%

Citigroup Nominees

1.4%

Cogent Nominees

1.1%


Looking at this there is only one major holding which virtually controls the company. This is I believe the former owners of the company before listing.

This gives ample room for institutional investors to move in and acquire major positions in the company. It should eb noted that some institutions have already taken notice those being Westpac, Citigroup, JP Morgan and National.

Share ownership is also available as a breakdown of the number of shares owned. This is available below:

Number of shares Shareholders

1-1,000

970

1,001 – 5,000

1,779

5,001 – 10,000

496

10,001 – 100,000

294

100,001 +

34

TOTAL

3573


This shows the majority of investors are small investors with up to 15K. It also shows that there are more than 30 which have a large stake ($150K+) invested into the stock. This breakdown shows that this stock appears to be a favourite of small investors.

Facts to consider:

  • The top shareholder has more than 50% of the company
  • The top ten shareholders own 82.1% of the company.
  • The top twenty shareholders own 85.2% of the company
What this is telling us is that only 41% of the company is there to be traded which means it may have higher volatility due to the decreased number of shares available for tradeing. Only 15% of the company is available to those not in the top 20 shareholders. This is an interesting statistic as if one of the institutional investors decides to sell their holding it could dramtically push down the price. On the other hand if a instutional investor wishes to purcahse the stock it could dramatically increase. This presents us with lots of opportunities to find value in the stock.
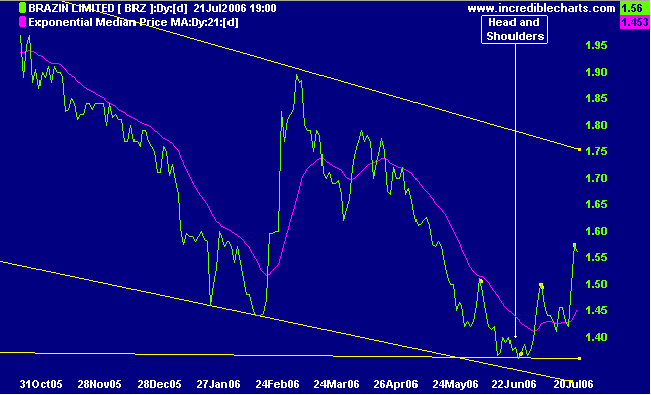
Charting the stock

Looking at the chart we can see the stock is up during the last three years but it has been steadily declining for the last year at least. It has found some support around 1.35 where it has rebounded. The overall trend for this stock is not good but short term we should see a rebound to the upper trend line which will be around $1.70.


Below you can see it has formed a head and shoulders pattern and this is one indication that the stock may be finishing its downtrend.


Growth

The latest half year earnings show growth in the following areas:
  • Sales growth of 21.4%
  • EBITAD growth of 31%
  • EBIT growth of 27%
  • Profit before Tax growth of 11.4%
  • Profit after Tax growth of 26.8%
  • Store Growth of 6.1%
  • EPS up 28%

The first thing to look at is where did this growth come from. This is explainable by delving a bit deeper into the numbers :

  • These results were over a 27 week period as opposed to 26 weeks
  • These results had an extra "Christmas trading week" this year and could have increased sales
  • Purchase of Diva contributing to these results for first time
  • HMV was acquired in October 2005 and may have had some impact.
  • Effective cost management is quoted which means cost cutting measures were used.
  • Removeal of loss making business and focus on core business has helped.

Future growth is likely to come from :

  • Good numbers from the core brands which are profitable.
  • Vertical integration is being explored to increase margins.
  • Enhanced tradig terms due to market share dominance in entertainment industry
  • Further cost cutting measures
  • The final removal of loss making brands from the business
  • Consolidation of recent purchase of HMV
  • Innovative product decisions ( Music Kiosk is a good idea and should generate solid profit)

Profitability
Profitability looks at the area on how much money (profit) is the company generating relative to the money which is invested into it. This is a key area as we need to invest in companies that make money and produce a return for their shareholders.

The first figure is Return on Assets. To determine ROA we do the following: Net Profit Margin / ( Sales / Assets ) = 3.1 / (502/ 251) = 1.55. Sales / Assets is the Asset Turnover.
The ROA tells us how efficient the company is turning the assets it has into money. This shows us that the company generates sales at 55%. This is explained as follows. Each Asset generates about 2 times (501 / 251) its values in sales. Therefore we divide the Profit by the Asset turnover and we get the return on the assets which works out to be about 55%. This is not a bad figure for this type of business.

Return on Equity is an industry standard to determine how well a company is performing and how well it is in creating wealth for its shareholders. The ROE for BRZ has been outstanding. The past 8 years has shown ROE figures of 20% or higher . This shows the company is doing a good job of managing their capital.

There are 3 ways a company can boost its ROE figures and this needs to be investigated before the figures can be regarded as authenticate returns. The ways a company can boost their ROE figures are net margins, asset turnover and financial leverage.

Net margins for BRZ are ok, and while it has a fair bit of debt shown by debt to equity ratio of 89/96 or 92% I think the companies management are on the correct path and should slowly reduce the debt over the next few years. To see whether the debt has helped the shareholders gain money can be seen by the ROE being higher than the ROC which is is in this case ( 20.8% for ROE vs 11% for ROC).

Free Cash Flow is another measure which can give some indications into how a business is prospering. Free Cash flow is very important as this is the excess money generated by the business which is available for shareholders ( or available for the company to reinvest and expand the business ). My preference is usually for the company to give dividends as I can probably better invest the money elsewhere. Looking at the financial report shows that BRZ likes to have high Payout Ratios (81%) and provides adequate dividends at 7.5%.
Free Cashflow is determined by taking the cashflow and removing the capital expenditure.

2005 Free Cash Flow = Cashflow – Capex = 7.6 – 18.7 = -11.1.

This shows that there may be issues with the company. Looking back a few years shows that this is an anomoly and is due to them purchasing a stake in Diva and Dusk. If we look back at the previous years we see a consistent value of around 20-25 million. Deteriming if this is enough free cashflow can be tricky as a guide we should aim for 5% of the sales revenue. Free Cashflow as per Revenue = 20 / 502 = 3.9% which is slightly below our target of 5%.
Overall while this is lower than our 5% I can see it growing in the future due to the direction management is taking with its brands and costs. I expect this figure to rise slightly as they remove unprofitable businesses.

Overall the company is profitable and managements direction to sell off any unprofitable businesses can only help the overall profitability.

Financial Health

Financial health looks at the current snapshot of the company and how well a foundation it has created itself. A company needs a strong financial health to ensure it does not run into extra costs and other financial burdens which could arise in the future.

The first figure to examine is the debt to equity. In this case it is 92%. This is a bit high due to recent purchases but I believe the purchase was a good acquisition and should enhance the profitability of the company.

The second figure is times interest earned which is how many times the company could pay the interest on its debt. The figure for the company is 7 which is a good figure considering the ASX average is 5 and the sector average is 6. This means they make enough money to cover their interest payments by 7 times.

The current ratio is how quickly a company could sell off assets to pay off debt. A general rule is 1.5 and BRZ currently has a current ratio of 1.37. This is ok but 1.5 is the benchmark. The quick ratio is very similar to above except it is a bit more meaningful as it removes inventories which may be sold at a price lower than they are worth. A ratio above 1.0 is a good figure and BRZ is showing 0.21. This adds a bit of risk to the company. It means without invetories the company does not have much in the way of collateral for debt payments. This company is inventory intensive and thus a lower figure can be expected.

A last test is to ensure the company has more Assets than it does liabilities. In this case BRZ has 328 million in total assets and 231 in total liabilities. This means if something drastic happened all debts could be paid and 97 million is available for shareholders.

Risks

There are numerous risks to this company including :

  • They sell luxury items which will not sell well in a recession. Interest rate increases and rising Petrol costs could hurt the business.
  • Ongoing price deflation on DVD'swill hurt their entertainment businesses
  • They are a seasonal stock and make most of their money in December and January.
  • They are competing agaisnt fierce compeititon and brand recognition is important. Losing brand recoginition could severaly hurt the company.
  • They have a large debt to equity ratio which they will need to reduce quickly in case of interest rate rises.

Management

Management is one of the most important aspects to look at when deciding whether or not to buy a company. it is management that makes all of the important decisions which could make or break the investment.

Firstly the renumeration policy should be checked. While I think all directors are overpaid, it is worthiwhile checking they are not excessively overpaid. The total cost of all directors is 2 million. This is a substatial increase on the year before which was 1.4 Million. The renumeration is broken into 3 parts, fixed salary, performance incentives and long term incentives. This at least puts some of the 2 million at risk and gives management a carrot to aim for. Overall 2 million is a bit excessive considering the Net profit was only 10 million. This is 20% of the overall profit. It should be under 10% of net profit.

Managements direction for the future needs to be looked at to ensure they are not boosting numbers now which will ultimately decrease profits in the future. Looking at BRZ they have focused on reducing costs which is a good thing. They are also selling off unprofitable businesses. This is also a good idea. I also like their direction of expanding the company by buying stakes in Diva and Dusk.

Overall I like the direction management is taking the company. They seem to be open about issues within the company and the direction they intend to take. They are coming up with new innovative solutions ( Music Kiosk) and are improving efficiency in existing operations ( BNT ).

Target Price and Sell Targets

The target buy and sell points will be different depending on different peoples analysis of the company. I do not subscribe to the Discounted value system and instead prefer some easier figures to tell me whether or not the company is at a good value.

Firstly I like a high dividend. Usually I would aim for 5% fully franked but there are always exceptions to the rule. In this case the dividend yeild is closer to 7% fully franked. I like a higher dividend to provide some buffer against a falling price. Based on the 5% rule I would stake a rough estimate of approx $2.30 ( 11.5c / 5%).

Secondly I like to see a PE ratio which is not too high. This differs between sectors. BRZ is at 7.8 while the market sits at 15.72 and 13.60. This shows that BRZ has a very low PE ratio compared to the average. I like PE ratios which are low as they provide a quick indication that the company is earning good money relative to their value. Something to be careful of though is that there might be a low PE because the price has dorpped based on thoughts that the future earnings might be smaller. Looking at BRZ shows estimates are for an increase in EPS from 20 to 25. If the estimates are correct assuming the PE ratio remains steady we should see BRZ move from the current price to $1.95. If we assume earnings are going to reamin steady and BRZ comes back to the sector average we should see it rise to $2.70 .

Technically I can see the share moving back to resistance around 1.70. It would need to break this level before it could start a nice uptrend.

Based on the price estimates of $2.30, $1.95 and $2.70 We would look for a buffer where we see value. Due to some of the comments above about managementsx high renumeration and a few of the risks we need to take a larger buffer. usually a 20% buffer is a good start but in this case a 30% buffer may be more reliable due to the slightly higher risks.

Using a 30% buffer puts the buy for each of the estimates at around $1.61, $1.36 and $1.89. This is a broad range of estimates on the value of the company. I like to take a figure somewhere between the lower two values and this would indicate a value somewhere around $1.40-$1.50.

Sell targets would be analaysed as the share releases new reports but initially we should stick to our lower estimated value of $1.95. At this price the share would be fully valued and any gain from there would be minimal. At that stage we should look for other shares unless this share is showing reasons for its solid performance.

Overall

I would declare this share as a medium risk investment with a possible Buy price of $1.40 to $1.50. Aim for taking profits around $1.95 which is a 30% profit.

Disclaimer : Please remember these are not share reccomedations for you as I have no idea what type of investor you are or what your financial position is. This is my analysis of the company and what prices I feel I would or am buying. I currently own BRZ and bought it at $1.40 a few days ago.

Saturday, July 22, 2006

Mortgage Choice Limited - Why I bought it

This is a copy of the document I wrote myself for Mortgage Choice Limited (ASX Code : MOC ). This was written before I bought the stock so that I could convince myself the stock was a good stock to own. It was particularly thought out as it was the first purchase for my self managed super fund.
Overview
Mortgage Choice Limited (MOC) operates a Franchise network which as at 30 June 2005 comprised 407 franchises (570 brokers) located throughout Australia. MOCs brokers advise borrowers on the range of home loan products available, assist them in the selection of a product that are suitable to their needs and submit loan applications on their behalf. The Company is focused on residential lending for owner-occupiers and investors, and originates home loans on behalf of a panel of 28 lenders

Company Strategy
MOCs strategy is to grow organically through the expansion of its franchise network. The strategy is appealing as it requires minimal capex expenditure.
Customer relationship marketing initiatives and training programs have been implemented to convert more leads, while the Client for Life initiative has been created to retain loans for longer. The SALES framework announced in June 2005 represents strategic focus on Strong marketing, Add-ons, Lender partnership, Efficiency and Shop growth.
MOC has indicated long-term growth strategies may include acquisition of compatible businesses and product diversification. Other strategies include the expansion of new retail premises in shopping centres which is expected to continue being rolled out throughout 2005. In June 2005 MOC confirmed its loan book stood in excess of $21.7bn, having grown 23% since 30 June 2004. Trailing commission rose as percentage of total income to $53.5 million representing 48.4% compared with 40.5% in the pcp. The FY05 result was driven by a combination of higher than anticipated trailing commission income.
MOC will have to maintain and build upon the relationship with its lenders to remain competitive within a slowing housing market and greater competition between lenders.
MOC has indicated that franchise network growth slower than anticipated Mortgage Choice reported NPAT up 27.92% to $12.74m for the year ended 30 June 2005. Revenues from ordinary activities were $110.51m compared with $102.89m last year. Diluted EPS was 10.9 cents, compared to 9.06 cents last year. The final dividend declared was 6.00 cents, taking the full year dividend to 9.8 cents


Instutional Ownership
A stock requires institutional ownership if it is to grow. This is because it is mainly the institutions that push the price of stocks higher with their ever increasing inflow of money (from superannuation). If a stock has too much institutional ownership it makes the stock stagnant and/or a favourite for speculators. The top shareholders are below: (Institutions are in blue)


Shareholder Shares Percentage of Company
National Nominees Limited 16,212,502 13.79
R G Higgins 10,366,583 8.82
Ochoa Pty Ltd 9,620,000 8.18
Basscave Pty Limited 9,520,000 8.1
P G Higgins 8,911,534 7.58
J P Morgan Nominees Australia Limited 8,589,174 7.3
RBC Global Services Australia Nominees Pty Limited 7,302,727 6.21
RBC Global Services Australia Nominees Pty Limited 7,040,009 5.99
ANZ Nominees Limited 5,334,891 4.54
Invia Custodian Pty Limited 2,810,000 2.39
Health Super Pty Ltd 2,067,159 1.76
SCJ Pty Ltd 2,000,000 1.7
SCJ Pty Ltd atf Jermyn Family Trust 2,000,000 1.7
Westpac Custodian Nominees Limited 1,572,195 1.34
AMP Life Limited 1,364,464 1.16
Bass Equities Fund No 1 Pty Limited 1,153,960 0.98
RBC Global Services Australia Nominees Pty Limited 1,034,985 0.88
Cogent Nominees Pty Limited 995,479 0.85
Cogent Nominees Pty Limited 895,161 0.74
Credit Union Australia Limited 800,000 0.68

This is from the 2005 annual report and may be out of date by 5 months. A good thing to note is that there are no major fund names in the list such as Colonial and Commonwealth Bank. It is these fund managers which could really push the price along


Share ownership is also available as a breakdown of the number of shares owned. This is available below:


Number of shares

Shareholders

1-1,000

82

1,001 – 5,000

343

5,001 – 10,000

222

10,001 – 100,000

202

100,001 +

55

TOTAL

904


This shows the majority of owners are small individuals who own between 1000 shares ($1530) and 10,000 shares ($15300). There are also a number of shareholders in the 10,000 to 100,000 range but this is a very broad range and the majority are probably towards the lower end of the spectrum. This lets us see that there is some institutional investment but that there is also a lot of small individual shareholders.

Facts to consider:

  • The top six shareholders hold more than 50% of the company
  • The top ten shareholders own 73% of the company.
  • The top twenty shareholders own 85% of the company.

Charting the stock

From a technical stand point (which is not the basis of this report) MOC appears to be in a long term uptrend. It has a support/resistance line at 1.54 which it continued to hit throughout the year.

It has moved roughly in line with the ASX 200 although the last short downtrend in Novemeber was not followed.

Volume on the stock has been small (pink) but large transactions have been followed by good movements.

In the short term the share appears to have spiked and will likely decline back to a manageable level on the support of $1.54

It is interesting to note that the stock has reached an all time high in the last couple of days.


Growth

Growth is analysed to determine how fast the company has grown, the sources or growth and how sustainable that growth may be. Mortgage Choice has had the following growth:

  • Earnings have grown 20%
  • Book Value have grown by 33%
  • Revenues have grown by 7%
  • Net Profit has grown by 20%
  • Cash Flow Growth of 14%
  • Loan Book Value increased by 23%
  • Loan Life Length grown to 3.8 years from 3.5 years

These are all nice areas of Growth. Revenue Growth of only 7% shows that some cost cutting must have been in place to ensure a growth of 20% in earnings.

This growth could have come from the following places:

  • Longer Life book therefore ensuring trailing commissions last longer and hold stable the company profit.
  • A brand name giving it a reputation that may pull more customers.

Future Growth could come from the following:

  • Increasing Market Share. Currently it is only 4.6%. This is because people are use to going to their banks to get the loan. This is slowly changing in society and Mortgage choice could pick up some more customers.
  • The current market is dismal and it is not a great time the last year to be looking for property. As more houses become available, the prices may drop and/or steady and more people will come back into the market.
  • People like to refinance their loans every few years to ensure they are getting the best possible deal. Mortgage choice can pick up some new customers and also grab extra trailing commissions from existing customers if they extend their loans.
  • Loans are only going to get larger as the economy grows as house prices will continue to rise. This will lead to bigger loans being approved and thus longer loan life and larger trailing commission.
  • This is a low capital intensive business and and the costs are scaleable which means the larger the business grows the lower the costs become as a percentage of operating revenue. For example this year the costs decreased from 25% to 23%.
  • More Franchises are an area of growth. Currently there are 407 franchises. These are mainly located in NSW, VIC and QLD. There is opportunities to open some more in Tasmania (1) and Northern Territory (1). Perth and Adelaide are also growing areas and could lead the franchise growth as they only have 46 and 30 respectively.
  • They are looking at Bolt-on Diversification. They are concentrating on the Commercial loans and Insurance areas. This is not the sort of growth I would like to see.

Full analysis for this company is not available as the company has only got 2 years worth of investment financials. Usually 5 years of data would give us a better picture.

Profitability
Profitability looks at the area on how much money (profit) is the company generating relative to the money which is invested into it. This is a key area as we need to invest in companies that make money and produce a return for their shareholders.

The first figure is Return on Assets. To determine ROA we do the following:


Net Profit Margin / ( Sales / Assets ) = 11.8 / (108 / 21.255) = 2.322.

Sales / Assets is the Asset Turnover.

The ROA tells us how efficient the company is turning the assets it has into money. This shows us that the company generates sales at 232%. This is explained as follows. Each Asset generates about 5 times (108 / 21.255) its values in sales. Therefore we divide the Profit by the Asset turnover and we get the return on the assets which works out to be about 232%.
This is a very large figure and shows that the company is very good at using what it has to generate a profit. In particular MOC has a very low level of capital expenditure and therefore has very little assets apart from Cash and receivables. Therefore I would say the figure is useless in the evaluation of this company and we need to look elsewhere for our analysis on profitability.

Return on Equity is an industry standard to determine how well a company is performing and how well it is in creating wealth for its shareholders.

The ROE for MOC has been outstanding. The past 2 years has shown ROEW figures of 145% and 130%. This shows the company is growing very rapidly.

There are 3 ways a company can boost its ROE figures and this needs to be investigated before the figures can be regarded as authenticate returns. The ways a company can boost their ROE figures are net margins, asset turnover and financial leverage.

Net margins for MOC are ok, and there is no financial leverage as MOC has 0 long term debt (which is great). The ROE figures are skewed a bit because of the asset turnover and the way it is structured. Still these figures are high for how it is structured and I am happy to take them as is and treat them as high ROE figures. This is because the figures have not be fiddled with by buying back shares or taking massive charges on the financial sheet.

Free Cash Flow is another measure which can give some indications into how a business is prospering. Free Cash flow is very important as this is the excess money generated by the business which is available for shareholders ( or available for the company to reinvest and expand the business ). My preference is usually for the company to give dividends as I can probably better invest the money elsewhere. Looking at the financial report shows that MOC likes to have high Payout Ratios (90%) and provides adequate dividends.

Free Cashflow is determined by Taking the Cashflow and removing the capital expenditure.

2004 Free Cash Flow = Cashflow – Capex = 10.7 – 1 = 9.7
2005 Free Cash Flow = Cashflow – Capex = 12.3 – 1.6 = 10.7

This shows that there is significant free cashflow in the business. Deteriming if this is enough free cashflow can be tricky as a guide we should aim for 5% of the sales revenue.

Free Cashflow as per Revenue = 10.7 / 108 = 9.9% which is above our 5% target.

Together we are looking for a High ROE and a High Free Cashflow figure. This company has both and is an excellent candidate for further analysis.

Financial Health

Financial health looks at the current snapshot of the company and how well a foundation it has created itself. A company needs a strong financial health to ensure it does not run into extra costs and other financial burdens which could arise in the future.

The first figure to examine is the debt to equity. In this case there is no debt which means that there is little money going into interest payments.

The second figure is times interest earned which is how many times the company could pay the interest on its debt. Again with no debt this figure is useless except in saying that the company will not have problems paying any long term debt at all. Commsec shows this figure as 10.60 which is much higher than the industry and ASX standards of 1.23 and 5.51 respectively.

The current ratio is how quickly a company could sell off assets to pay off debt. A general rule is 1.5 and MOC currently has a current ratio of 1.40. This is ok but 1.5 is the benchmark.
The quick ratio is very similar to above except it is a bit more meaningful as it removes inventories which may be sold at a price lower than they are worth. A ratio above 1.0 is a good figure and MOC is showing 1.38. This vastly improves the ability of the company to pay any liabilities and allows us to place little emphasis on the current ratio.

A last test is to ensure the company has more Assets than it does liabilities. In this case MOC has 21.255 million in current assets and 15.236 in current liabilities. There I no long term debt. This means if something drastic happened all debts could be paid and 6.01 million is available for shareholders.

Risks

This is the most important section as it has two uses. The first is it allows us to evaluate why we might not want to buy the stock at this point. The second use is as a future reference to help us evaluate when we might want to get out of the stock ( if we ever get in ).


Here are a list of Reasons / Risks on why this stock is not a great stock :

  • Currently priced at a very high historical figure and is within 10% of its current high. This stock may already be overpriced.
  • MOC is in a very competitive environment. It is an area of high returns and is drawing many competitors who are all trying to out do each other.
  • They are currently in a dispute with franchise owners and this could cost money and divert managements attention from running the business
  • Borrowers are currently moving out of the higher paying loans ( Line of credit loans ) to more traditional loans. This could reduce profit margins.
  • There has been some minor management changes and whether these new managers are adequate is not fully understood.
  • There is a national Broker regulation which could become standard. This could add extra costs to the business.
  • A number of competitors are merging and the industry is consolidating. This means bigger competition to compete with and this could drive down profit margins.
  • The lenders could reduce or change the commission structure. This would be detrimental to the business as this is where all of its money is derived.
  • The housing economy could slow dramatically and people could stop taking loans for a period of time. MOC is slightly buffeted against this by its existing loan book but any dramtic slowdown will influence profits.
  • This is a young company and the figures are only available for 2 years worth of data. This does not allow an adequate analysis of the company over a longer timeframe to ensure it can withstand market cycles.
  • The share price is very low $1.55 and it can swing dramatically which could influence the returns significantly.
  • There is some query as to the number of shares increasing dramatically each year which basically means each current shareholder is losing a % of the company they currently own. This is due to Option packages and employee purchase plans. This is a usual thing in most companies though.

This list gives us some insight into why this might not be a great stock to pick. It shows a number of reasons that the company could dramatically decline. To minimise these risks we need to invest in companies with good management who can assess the risks and ensure that they have adequate solutions.

Management

In Management is where the shareholder puts a lot of trust. They run the business and are essentially our employees. Management needs to be analysed as a bad management team can run a good business into the ground.


Areas to look at include:

  • Past management performance
  • Remuneration packages
  • Character

The first thing to look at is how management has run the business in the past. This is hard with MOC as it has only been running 2 years but in that time it appears that management have done an excellent job. There is free cash flow available for shareholders, and they are paying out a high payout ratio.

Compensation (Remuneration packages) are sometimes a cause for concern. In this case it is a casue for concern when you read the document for “Performance Evaluation of Directors”. There is no performance incentive that ties the board to the results of the company. They are evaluated on loose fitting areas which they can/will always meet. Luckily this hasn’t been a problem yet but it is something that needs to be watched. One thing I did like was that it was tied to risk management. There are a number of risks facing the company and I am glad this at least is past of their performance reviews. Reading further suggests that their pay is not tied to the performance evaluation but is tied to policies and practices which are focused on performance and aligned with the company’s vision, values and overall objectives.
The company runs an incentive Bonus Option plan as part of its remuneration package. This is not a great idea. Yes it motivates the directors but it dilutes the stock. This dwindles away the share each shareholder has in the company as a percentage.

Character looks how honourable and trustworthy is management They have numerous charters which say how they should act and at this stage there is no blaring evidence that they are untrustworthy. The only bad sign I could see was that they changed their strategy from year to the next which was focus on the central business one year and the next was to look for bolt-on diversifications. This may have been because of the good year they had and the excess money they had but it is hard to tell. At this stage the director’s character seems ok.

Target Price and Sell Targets

I also filled out these sections on my own report but feel the math is not required to be posted here at this time. I have posted this for historical purposes for people to use and the target price to buy and sell will differ depending on what/how people have read my analysis above. Saying that MOC might still be under my target buy price ... : )

Good Luck

Where I was, where I am now, and where I am going ....

I hope you enjoy following this saga as I intend to outperform the index (ASX 200) by 5 points (or 5%) a year. Since I started this 6 months ago for real I can take you through where I was, where I am now and where I am heading.

I started trading my superannuation (as well as invesment money) using fundamental analysis back in January 2006. My first purchase was MOC on 3rd Jan 2006.
The time line of my purchases is below :

  • 03/01/2006 - MOC ($1.53)
  • 22/03/2006 - ASU ($0.022)
  • 27/03/2006 - MMA ($0.93)
  • 11/05/2006 - ITF ($1.04)
  • 30/05/2006 - MCW ($1.875)
  • 18/07/2006 - BRZ ($1.40)
  • 18/07/2006 - FUN ($1.725)
One thing that should be noted is that I have not done many trades. In fact I still hold all of these positions. Today (22/07/2006) shows that 5 of the 7 stocks are in profit (after dividends are taken into account).

The highest return has been MOC with a 77.4% return. The lowest is a 9.1% loss in ASU. Of the 5 stocks which are in profit 3 are up by more than 10% ( 11.4%, 34.6% and 77.4%). The other 2 are showing 2.9% and 2.1%. Those down are down by 9.1% and 1.4%. With ASU being down 9.1% is not a major hit to the portfolio as it has the smallest allocation of capital as it is a speculator due to its price.

So that pretty much covers where I am. Performance on the portfolio is a return of 17.3%. The majority of money has not been invested for the timeframe which makes this return even more special to me as it shows a good displine on when and where I am placing my funds.

During the same time frame the ASX 200 has advanced from 4780 to 4960. This is a gain of 3.7%

The aim of my trading is to outperform the index by 5% a year. I am extatic that I am currently above the targeted goal.

I believe that has outlined what I have been doing, how I am currently situated and where I intend to head in the future as far as goals.

Please keep in touch and add any comments on any of the articles I post as it is here for me to learn from you as much as it is here for you to learn from me.

Good Luck investing

Why Fundamental Analysis ?

Before I delve into why and how I buy my shares I thought it would be a good idea to give a brief outline of fudamental analysis and why I use it.

Fundamental analysis is using the numbers behind a company rather than the price to determine the value of the company. Whereas Techincal analysis firstly looks at the price and what it has/has not been doing, fundamental analysis focuses on how much money the company made and will it continue to make money in the future.

Well known fundmanetal analysts include Bejamin Graham and Warren Buffett. These people pioneered how to value companies and the importance of getting value.

I have focused on using fundamental analysis with a touch of technical analysis to develop a loose system within which I make my decisions. They are not always based on the same thing ( for example Price Earnings Ratio might be important in one instance and useless in another) but the overall idea is to find a company which is making lots of money and/or will make lots of money in the future and then deciding what price is a good price.

There are many companies on the ASX which are making profits and are forcast to dramatically increase profits but there are not many which we can get at a bargain price.

One thing I hope to do is to add a watchlist of companies which are looking good from a fundamental perspective but are not at a good value. That way if we notice they have fallen to an acceptable level we are ready to grasp the opportunity.

Good Luck

ASX Investing

I have been trading and investing on the ASX (Australian Stock Exchange) for a few years now. This has been an enjoyable experience but has had some major ups and downs.

As most of my trading/investing is now done within my Superannuation fund I thought I would post my comments on the stocks I have bought already and future stocks which I am contemplating buying.

To start of with I should outline the major positions I currently hold. These include:

1. MOC bought at $1.54 (Currently $2.70)
2. ASU bought at $0.022 (Currently $0.021)
3. FUN bought at $1.725 (Currently $1.77)
4. BRZ bought at $1.40 (Currently $1.56)
5. MCW bought at $1.875(Currently $1.83)
6. ITF bought at $1.04 (Currently $1.35)
7. MMA bought $0.93 (Currently $0.92)

ITF has been taken over and these shares will be automatically sold within the next few days. This was a very profitable trade for me as I had been watching the share for several weeks and the takeover announcement came only hours after I bought the share.

MOC has been a shining light of the portfolio. It was purchased mid trend as it headed higher and conistenetly produced stunning results. It has almost doubled in price.

FUN was only recently purchased and has headed in the right direction from the outset. I will try to post a detailed entry on why this stock has a future and why it will rise dramatically int he next few years.

BRZ has another recent purchase which moved 10% which a very short time frame and has come back slightly. This stock was purchased when it was out of favour yet it continues to produce good financial results which should hold the stock at this price and eventually push it higher.

MCW was purchased shortly before a dividend and while it is showing a capital loss it is actually showing a gain after dividends are taken into account.

MMA is slightly down from the time it was purchased but it is a good fund to have money in and adds a slight bit of diversity to the portfolio. It should outperform the market in a bear enviroment and I suspect the repurchase of shares will hold the company at its current price.

ASU is a speculative buy due to its small capitalisation. It is a growing company which should eventaully climb in value as the profit start to increase. Management is eager to expand its business and I belive the share is worth closer to 4c than 2c.

Hopefully I will keep the blog up to date with lots of detail which will help others.